The St. Louis Fed Financial Stress Index has risen above the zero line, increasing to 0.09.
Here’s the chart:
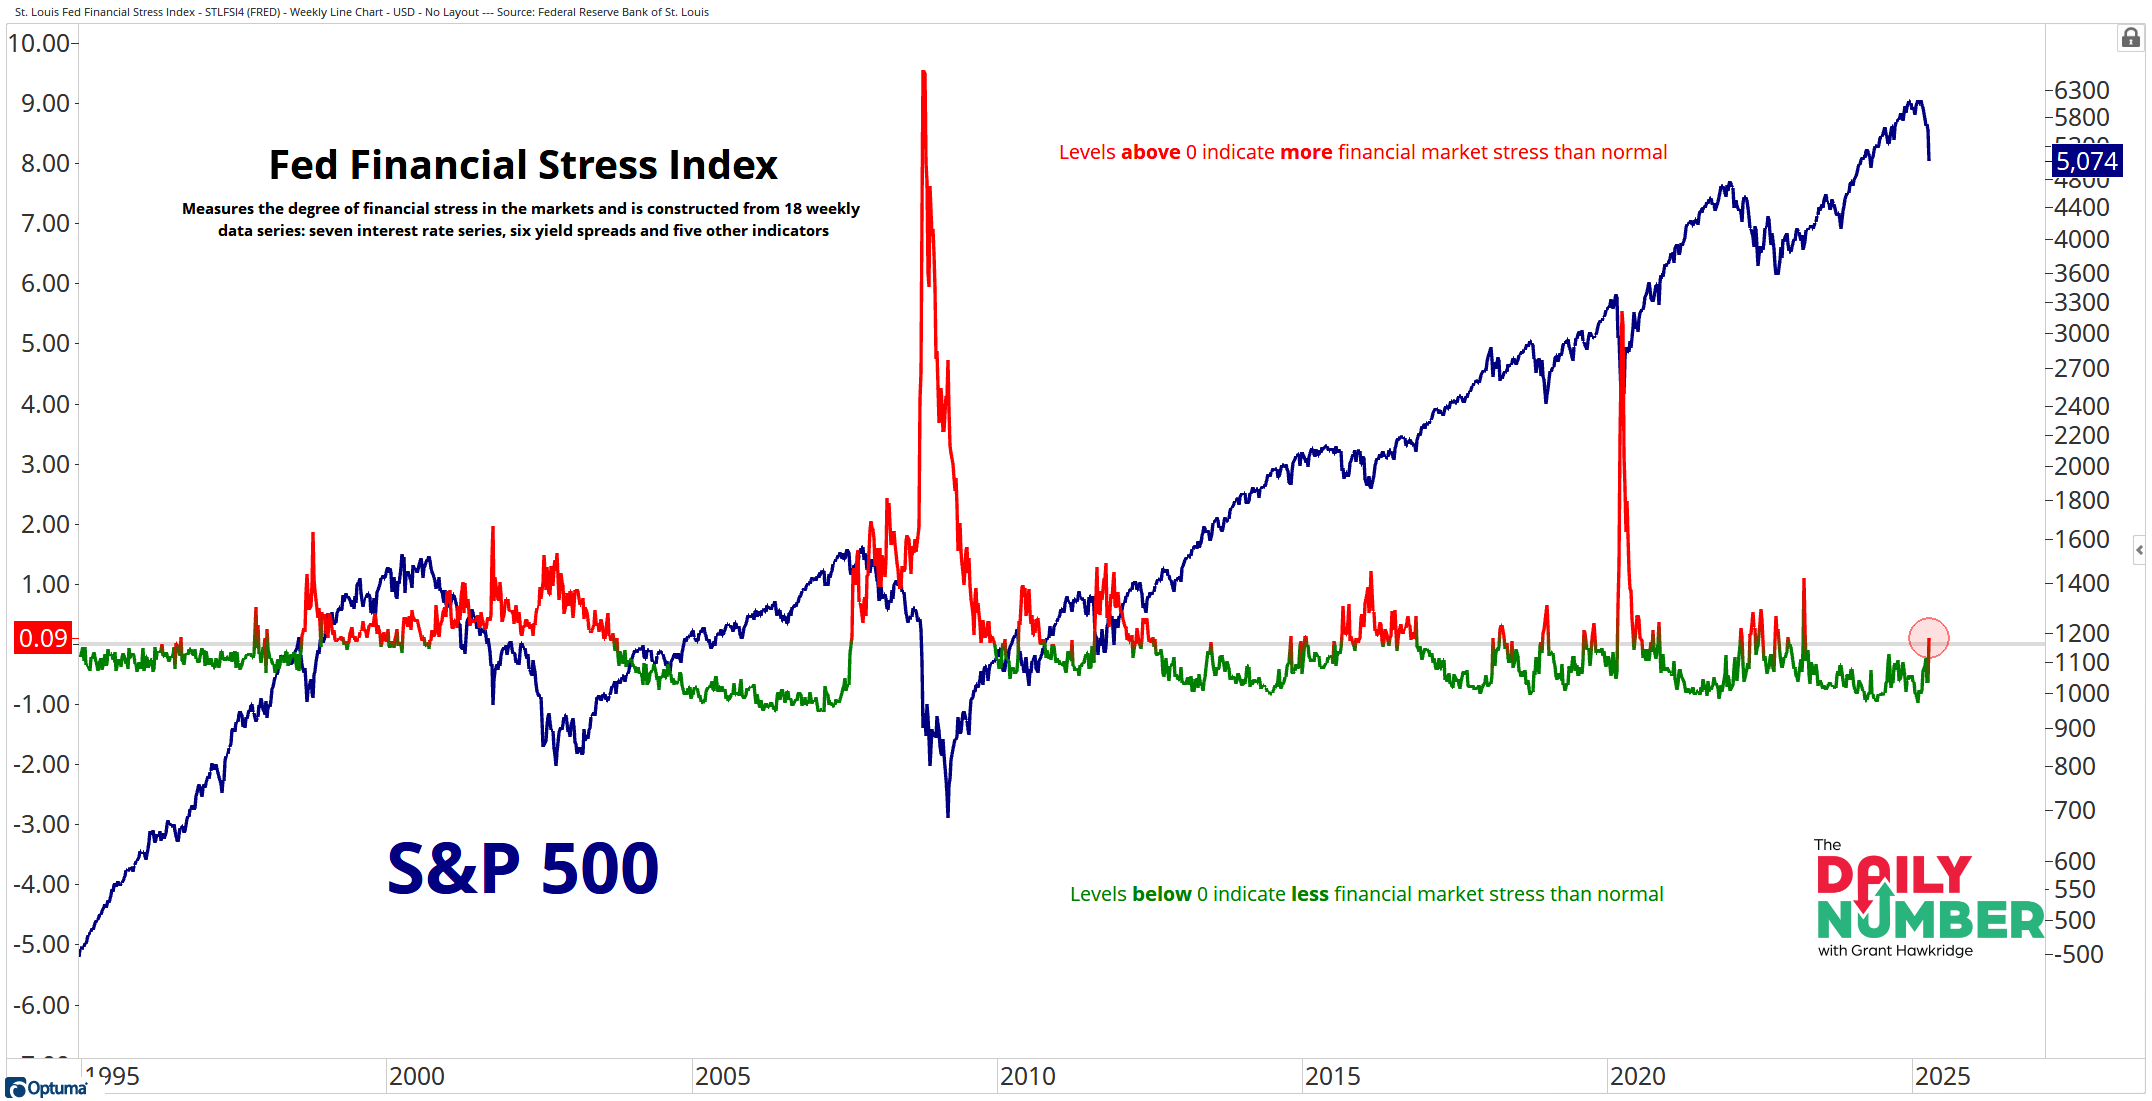
Let's break down what the chart shows:
The blue line represents the price of the S&P 500 index.
The green/redline represents the St. Louis Fed Financial Stress Index. When the line is green, it indicates that financial market stress is lower than normal. Conversely, when the line is red, it indicates that financial market stress is higher than normal.
The St. Louis Fed Financial Stress Index measures financial stress in markets and is published by the Federal Reserve Bank of St. Louis. This index is constructed from 18 weekly data series: seven interest rate series, six yield spreads, and five other indicators. Each of these components provides insights into different aspects of financial stress.
The Takeaway: Here is another data point for the bears…
The St. Louis Fed Financial Stress Index has reached its highest level of market stress observed in two years. After being below the zero line for 105 consecutive weeks, this trend has changed this week.
When the index is above zero, it indicates more financial market stress than normal… Are you stressed?
Many data points in the St. Louis Fed Financial Stress Index are derived from the bond market, the largest market in the world. With above normal stress levels being reflected in credit conditions, this suggests that investors are becoming increasingly cautious, leading to a greater avoidance of risks. This behavior could pave the way for further developments in the stock market, potentially impacting stock performance, as there is already downward pressure in the stock market.
Should we be concerned when the bond market experiences stress? Probably…
While it's not at the levels observed during the global financial crisis or the COVID crash, it’s heading in that direction.
Grant Hawkridge | Chief Aussie Operator, All Star Charts
PSS: Steve is going LIVE again todayat 9.45am ET to discuss the current action.
He will cover what’s working, what’s not, and what comes next. You’ll see live charts, key price levels, and exactly how he is thinking about new opportunities as this market shakes out.
If you find my content valuable, I would greatly appreciate it if you could share it with your friends, family, and colleagues. Your help in spreading the word is invaluable in supporting our work. Thank you to all of you who share!