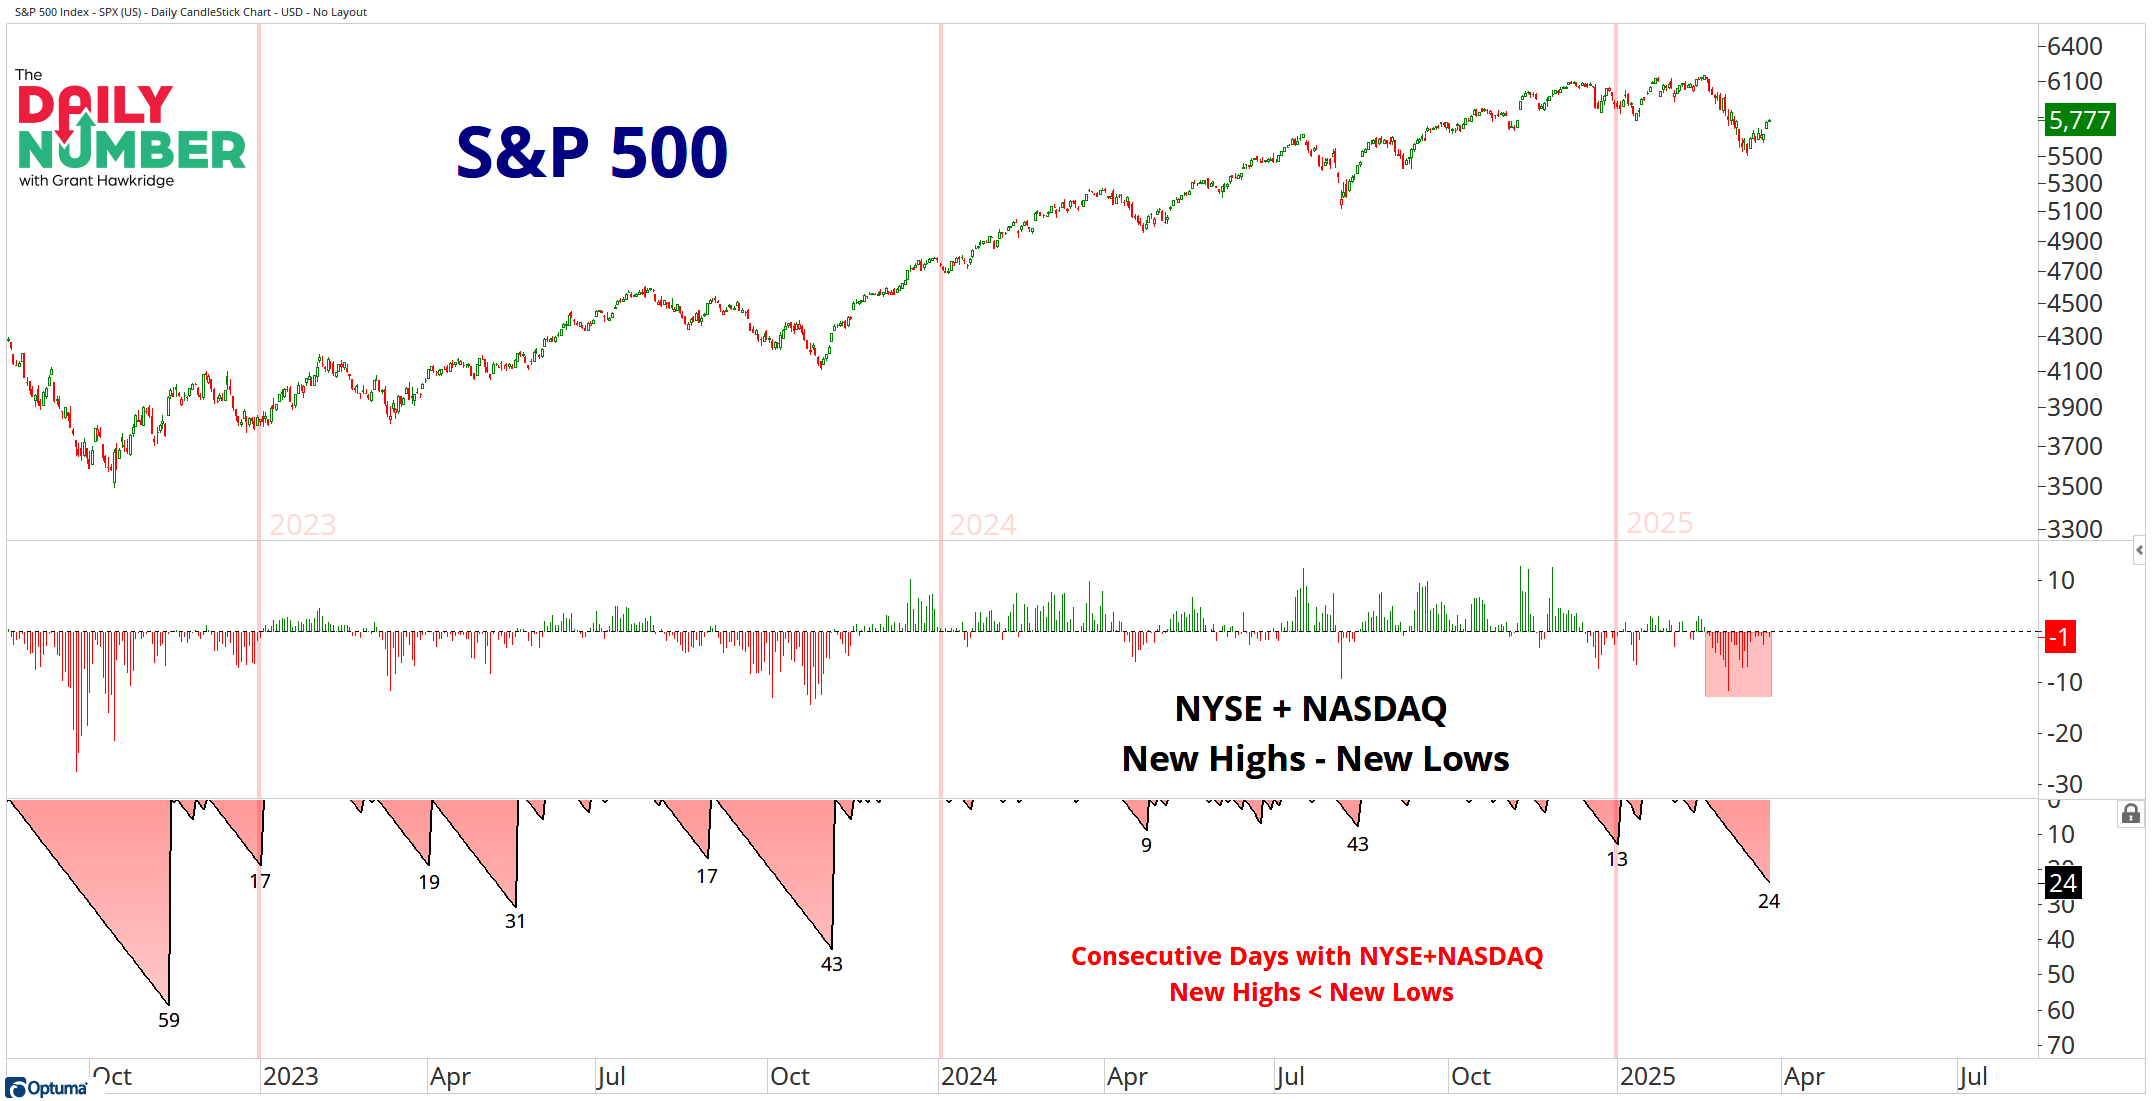
We have experienced 24 consecutive days where the number of 52-week new lows on the NYSE + NASDAQ exceeds the number of 52-week new highs.
Here’s the chart:
Let's break down what the chart shows:
The green and red candlesticks in the top panel is the S&P 500 index price.
The green and red lines in the middle panel is the NYSE + NASDAQ 52-week new highs - 52-week new lows.
The red shadings in the bottom panelshows the consecutive days with NYSE + NASDAQ 52-week new lows > 52-week new highs.
The Takeaway: Bulls are making a strong effort following the recent market correction. However, NYSE + NASDAQ 52-week new lows are still lingering. This marks the highest level of consecutive days of new lows outpacing new highs we've seen since the last 10% market correction back in October 2023. This is the third longest period of consecutive days with NYSE + NASDAQ new lows > new highs during this current bull market.
But, the Bulls have completed the first stage of finding a bottom - Stocks must first stop declining, and in the Bulls' defense, the number of new lows has been decreasing since the most recent peak at the beginning of the month.
During bull markets, it's not uncommon for new lows to exceed new highs. However, this trend may become challenging for the Bears in the future, as the Bulls have shown resilience over the past week or so.
Grant Hawkridge | Chief Aussie Operator, All Star Charts
PS: Gold already made its move — now it’s time for what comes next. Copper, silver, and the rest of the commodity space are setting up, and JC and Jason are ready to break it all down. Join them live this Thursday at 4 p.m. Eastern to see exactly where the money is flowing next. Register now.
If you find my content valuable, I would greatly appreciate it if you could share it with your friends, family, and colleagues. Your help in spreading the word is invaluable in supporting our work. Thank you to all of you who share!