With the S&P 500 index reaching a new all-time high yesterday, this current bull market has persisted for the past 587 trading days.
How much longer can this run continue?
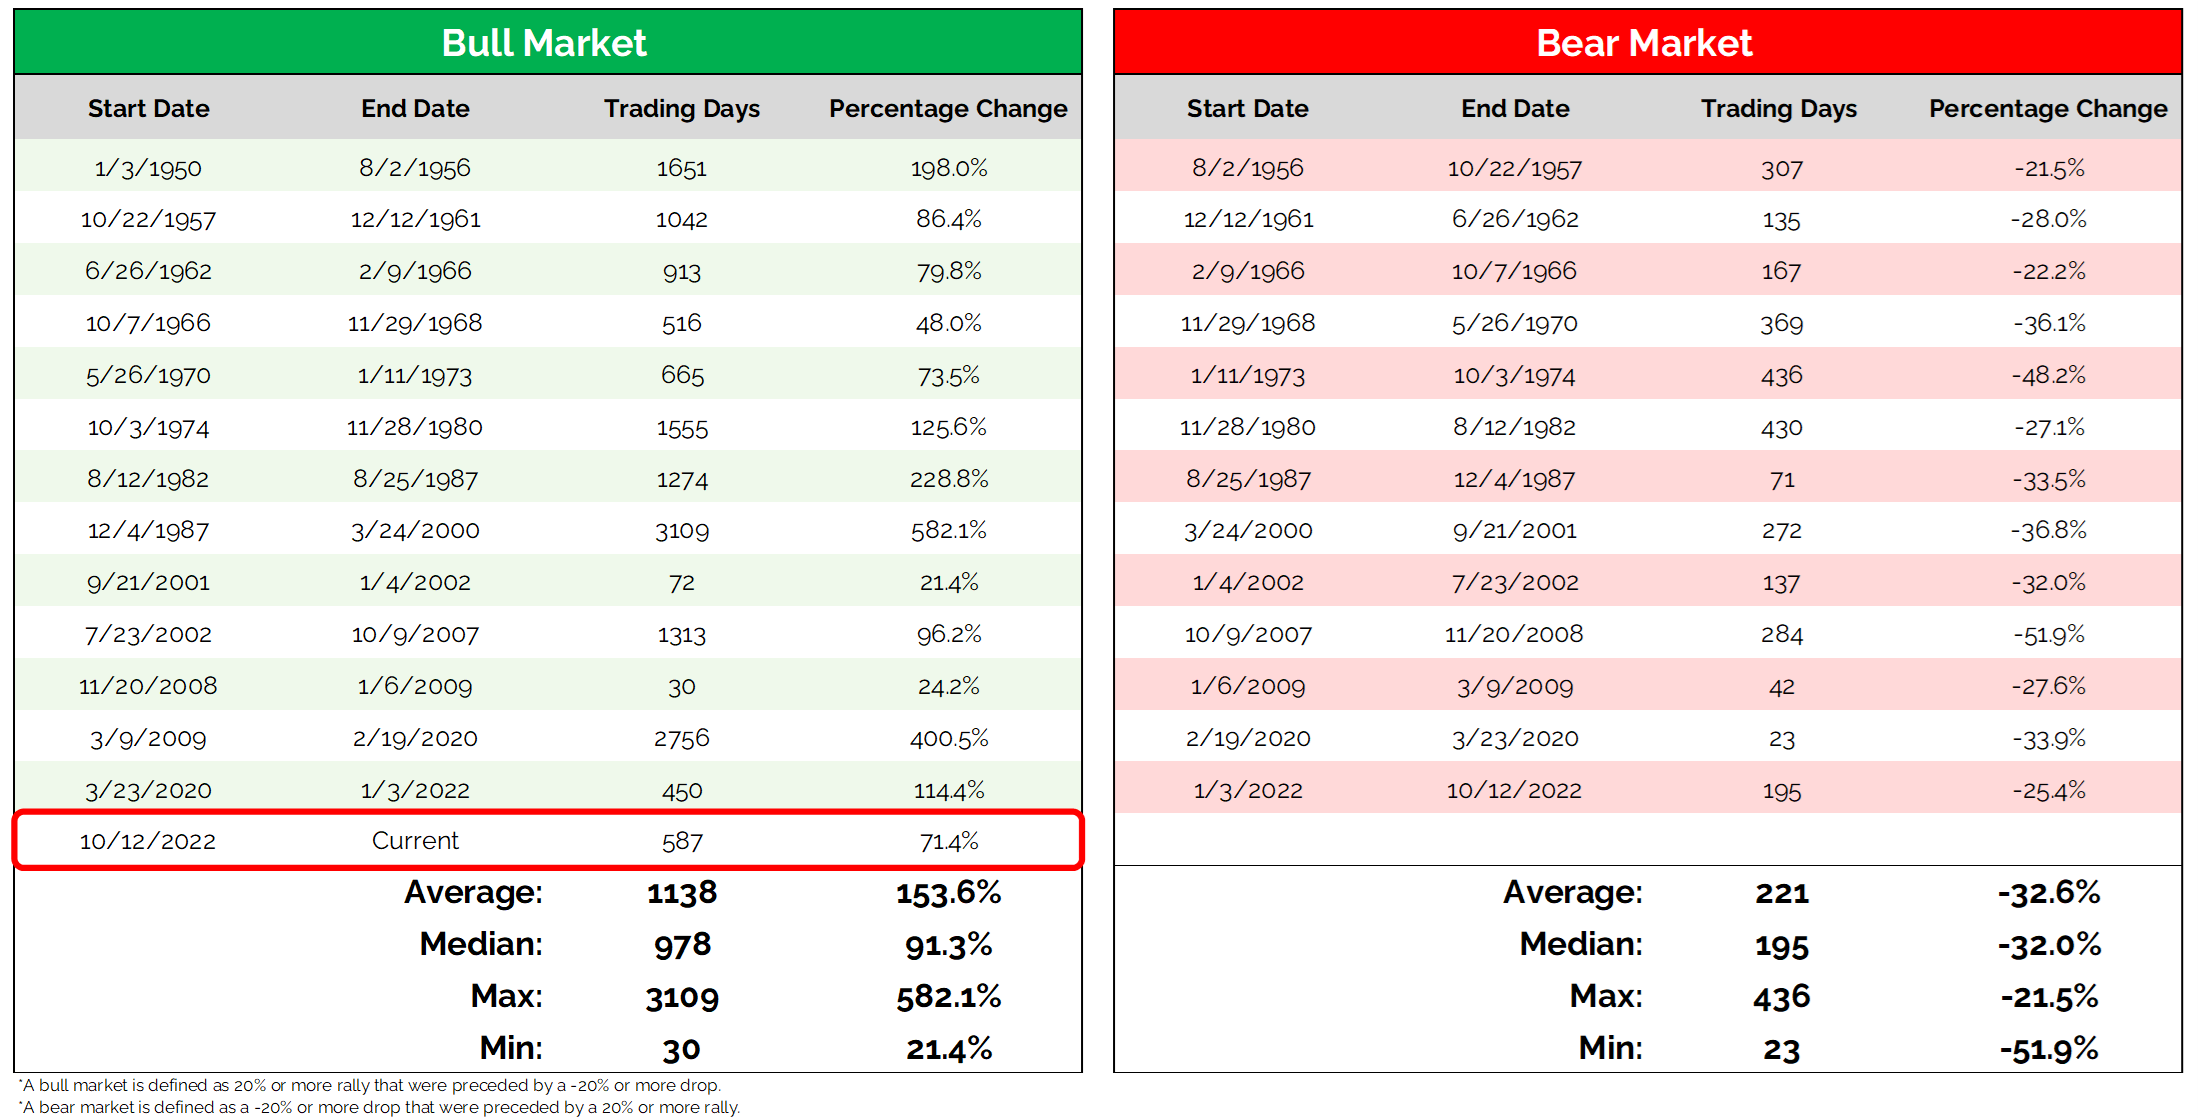
Here is the table:
Let's break down what this table shows:
The green box represents all of the bull markets dating back to 1950. A bull market is defined as a rally of 20% or more that follows a drop of 20% or more.
The red box represents all of the bear markets since 1950. A bear market is defined as a drop of 20% or more that follows a rally of 20% or more.
The Takeaway: There is nothing more bullish than hitting all-time highs.
Yesterday's all-time high marks the second all-time high for the S&P 500 index in 2025. Over the last 587 trading days, this bull market has delivered a remarkable return of 71.4%. However, it’s important to note that the average bull market lasts around 1,138 trading days and typically achieves a return of 153%. Consequently, this bull market, while strong, is still below the average in terms of both duration and overall return.
This data tells me that there is still room for this bull market to continue its upward trajectory.
Grant Hawkridge | Chief Aussie Operator, All Star Charts
ICYMI: Steve Strazza has been absolutely crushing it with his Breakout Multiplier trades. His next alert is dropping soon, and he is offering a 40% discount to get you in. But the deal ends today.
If you find my content valuable, I would greatly appreciate it if you could share it with your friends, family, and colleagues. Your help in spreading the word is invaluable in supporting our work. Thank you to all of you who share!