The percentage of world markets above their 50-day moving average has surged to 86%. But how strong are these trends?
Here’s the chart:
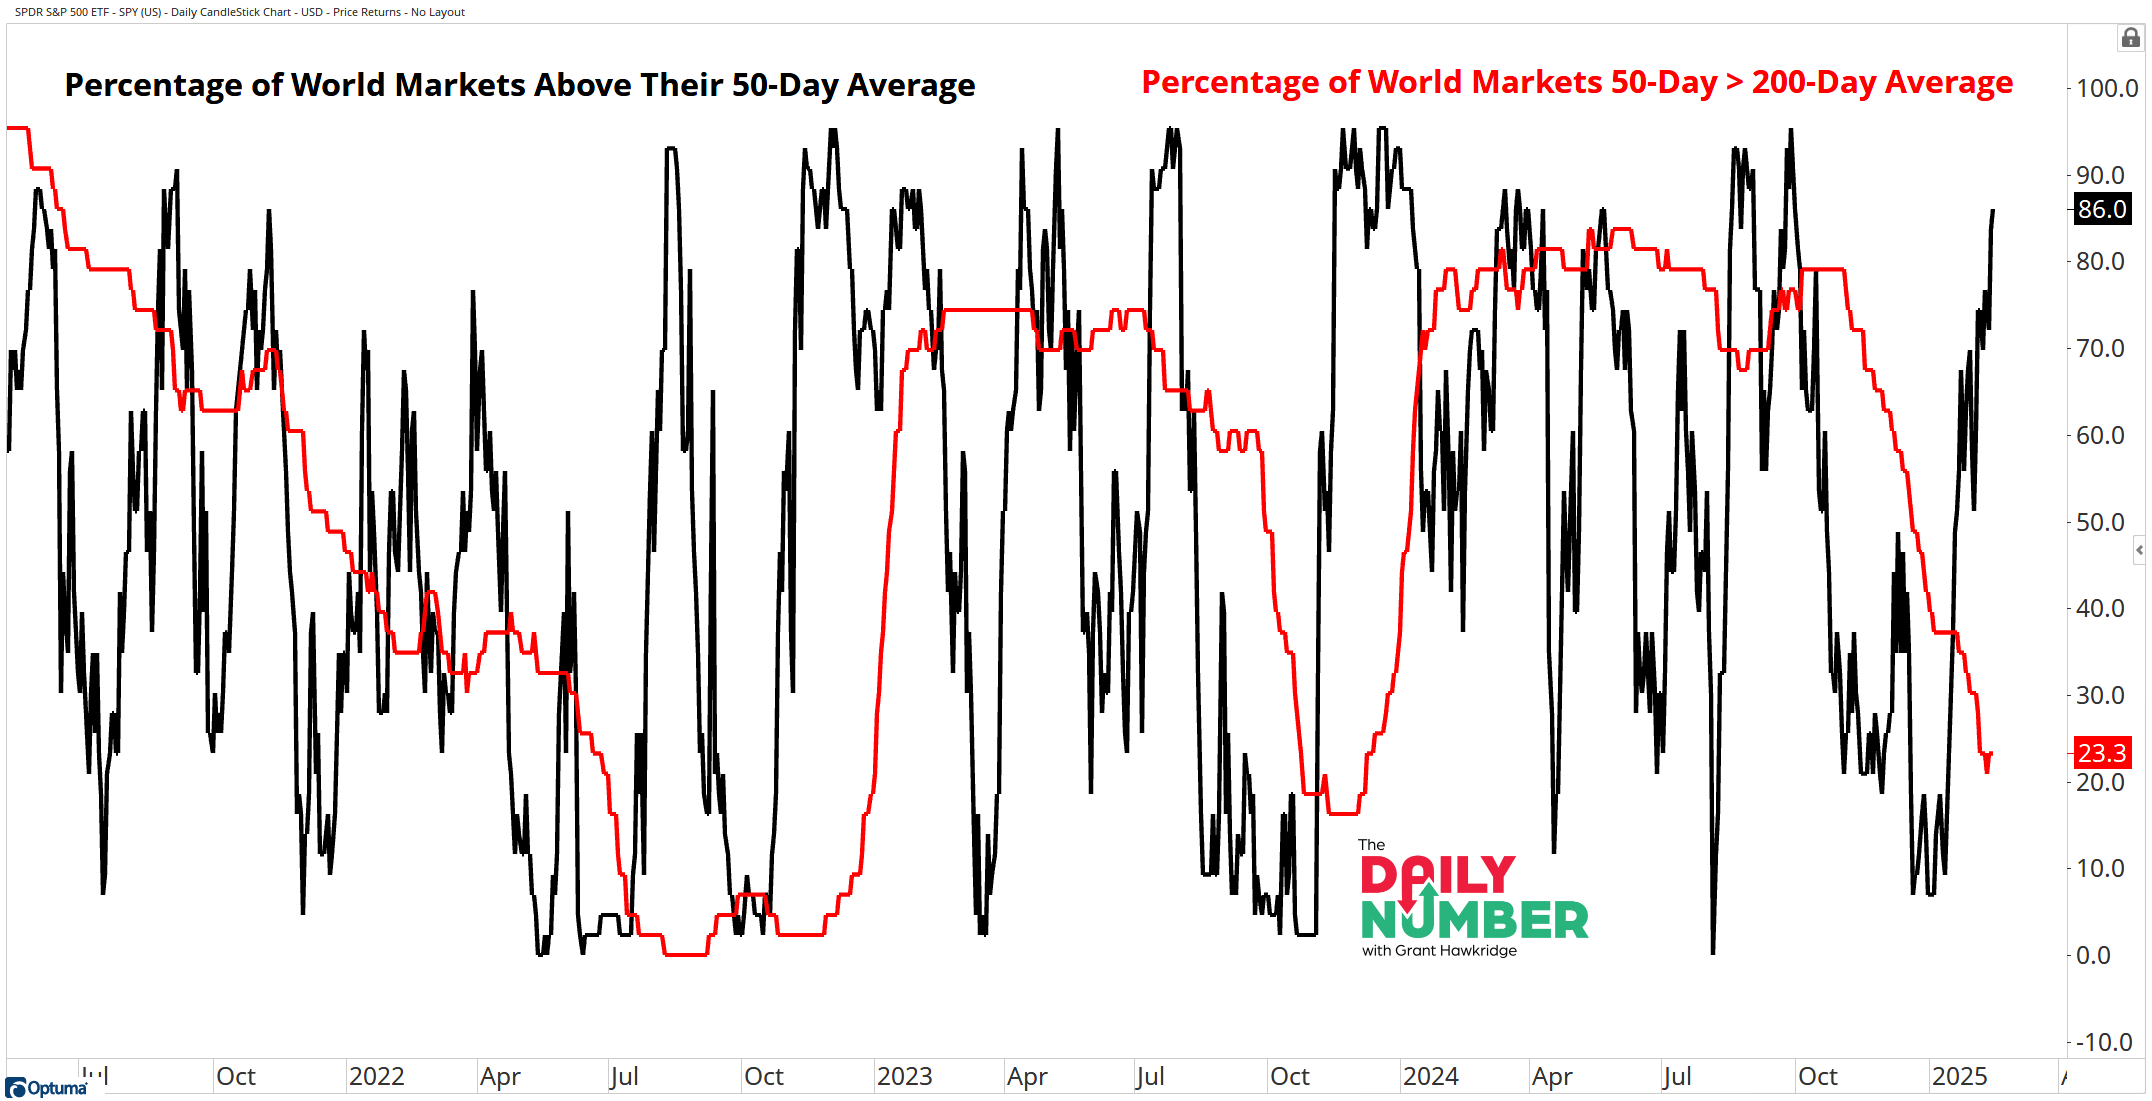
Let's break down what the chart shows:
The black line shows the percentage of world markets above their 50-day average.
The red line shows the percentage of world markets that have a 50-day average greater than their 200-day average.
The Takeaway: The key development here is that global breadth is improving, which is typically supportive of US stocks. Currently, the percentage of world markets above their 50-day moving average has reached its highest level since September of last year. This recent increase in global breadth readings suggests that the underlying short-term strength in the market is healthy, potentially presenting short-term opportunities.
While this is a promising starting point for world markets, the overall trend strength of most world markets remains weak. To clarify how I identify a strong uptrend: is when the 50-day moving average is above the 200-day moving average. Currently, only 23% of world markets have their 50-day moving average above their 200-day moving average. This indicates that the bulls still have work to do in order to solidify this recent move and ensure that this short-term strength has lasting power.
Grant Hawkridge | Chief Aussie Operator, All Star Charts
PS. JC hosted his latest conference call on Monday. It was full of charts and trade ideas. Don’t miss it.
If you find my content valuable, I would greatly appreciate it if you could share it with your friends, family, and colleagues. Your help in spreading the word is invaluable in supporting our work. Thank you to all of you who share!