Bearish market sentiment continues to rise, with our Average Bears indicator reaching 38.8 last week. Meanwhile, the S&P 500 index achieved a weekly all-time high... Things that make you go, hmmm.
Here’s the chart:
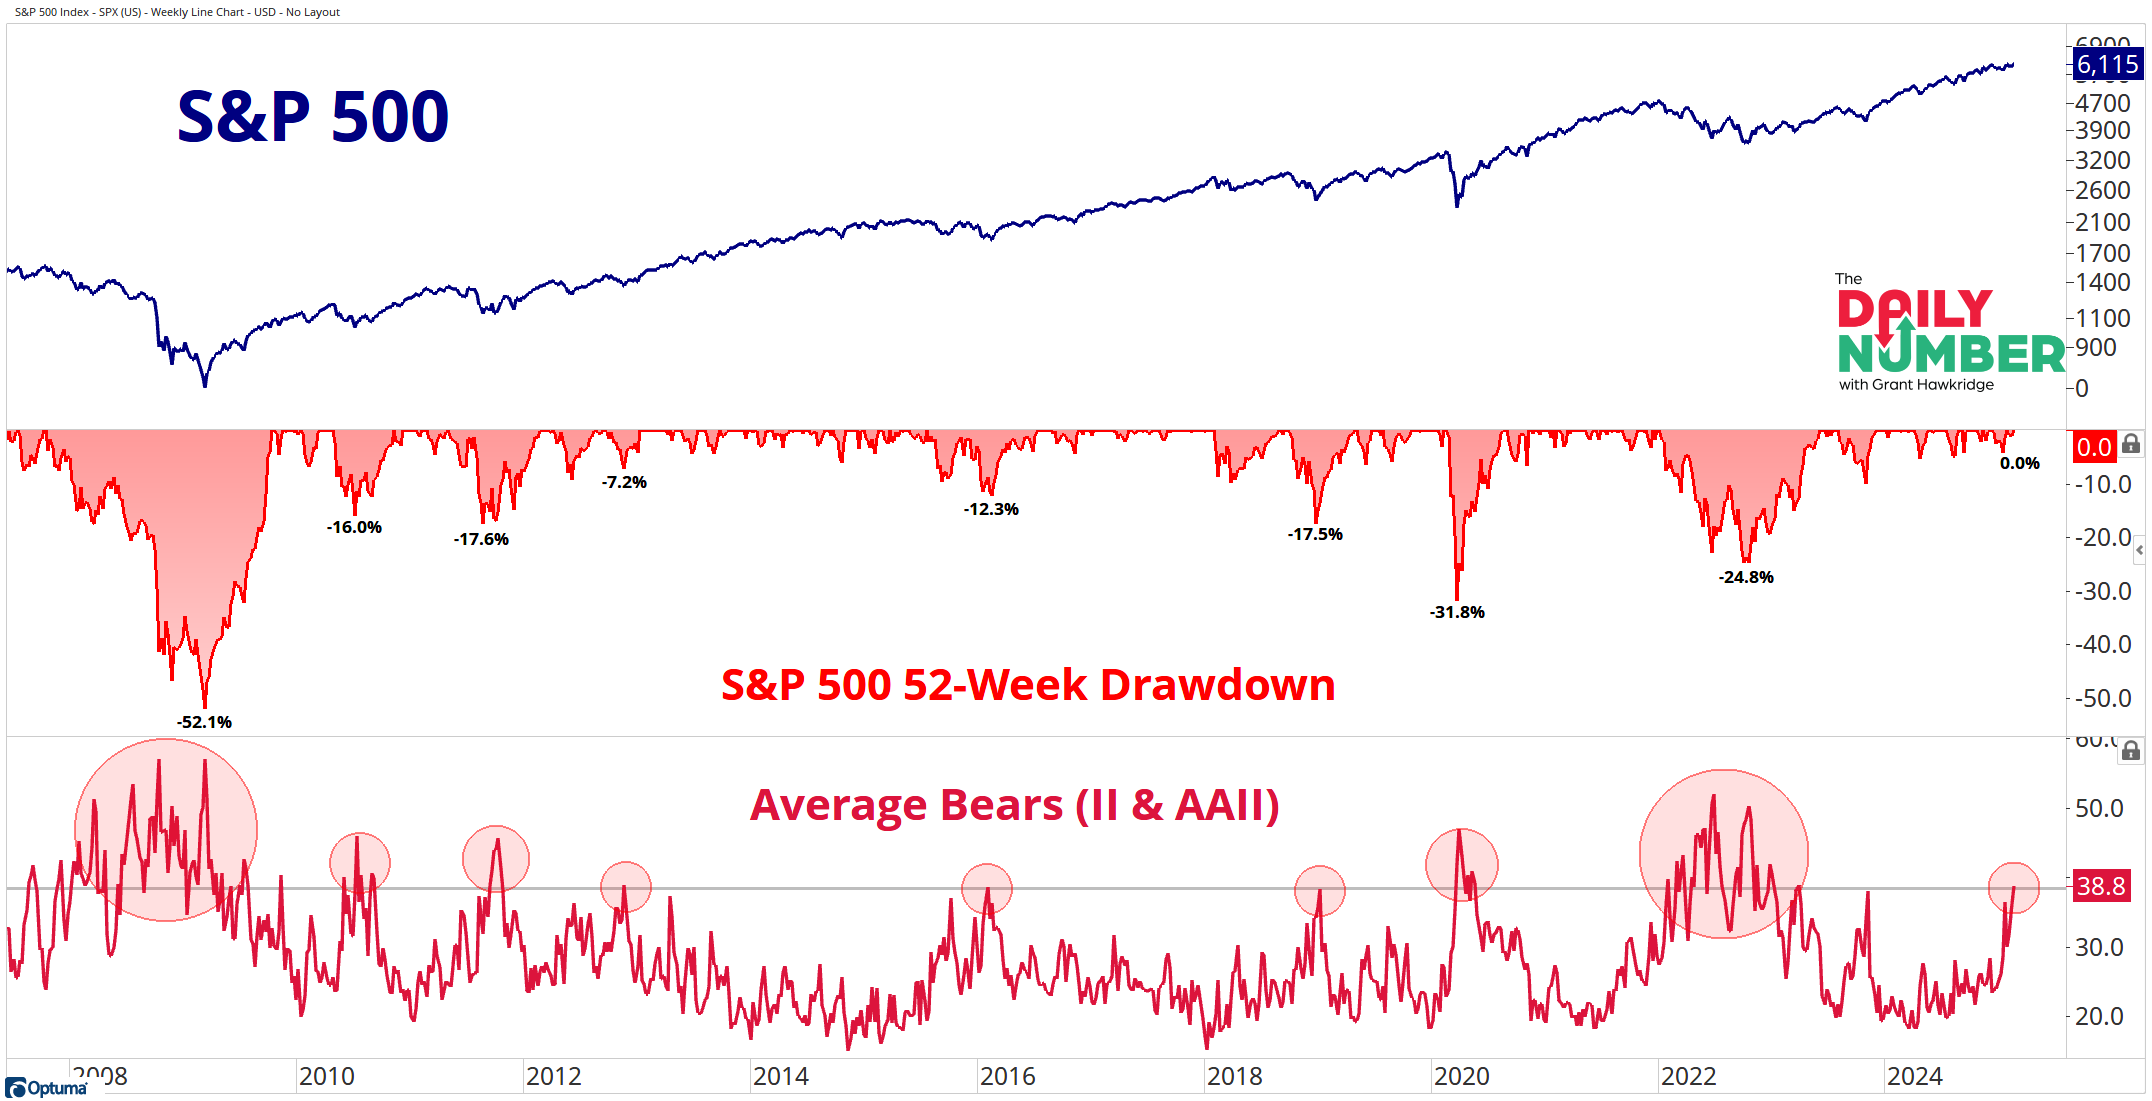
Let's break down what the chart shows:
The blue line in the top panel represents the price of the S&P 500 index.
The light red line in the middle panel shows the S&P 500 index 52-week drawdown.
The dark red line in the bottom panel shows the average bears from the Investors Intelligence (II) and the American Association of Individual Investors (AAII).
The Takeaway: An increasing number of bears have entered the market, this is illustrated by our average bear indicator, which has risen to its highest level since March 2023. Typically, when we see this many bears in the stock market, we are somewhere in the midst of a market drawdown. However, by the close of trading on Friday, the S&P 500 index finished the week at new all-time highs.
They normally say, "Nothing Changes Sentiment Like Price" so why is it different this time…
Do the bears have insights that we are unaware of? Maybe…
Right now, the lesson here is that the stock market just doesn’t care how investors are feeling.
This is why it's important to pay attention to what really pays us… price!
Grant Hawkridge | Chief Aussie Operator, All Star Charts
PS. JC will be hosting his latest conference call today. It will be full of charts and trade ideas. Don’t miss it.
If you find my content valuable, I would greatly appreciate it if you could share it with your friends, family, and colleagues. Your help in spreading the word is invaluable in supporting our work. Thank you to all of you who share!