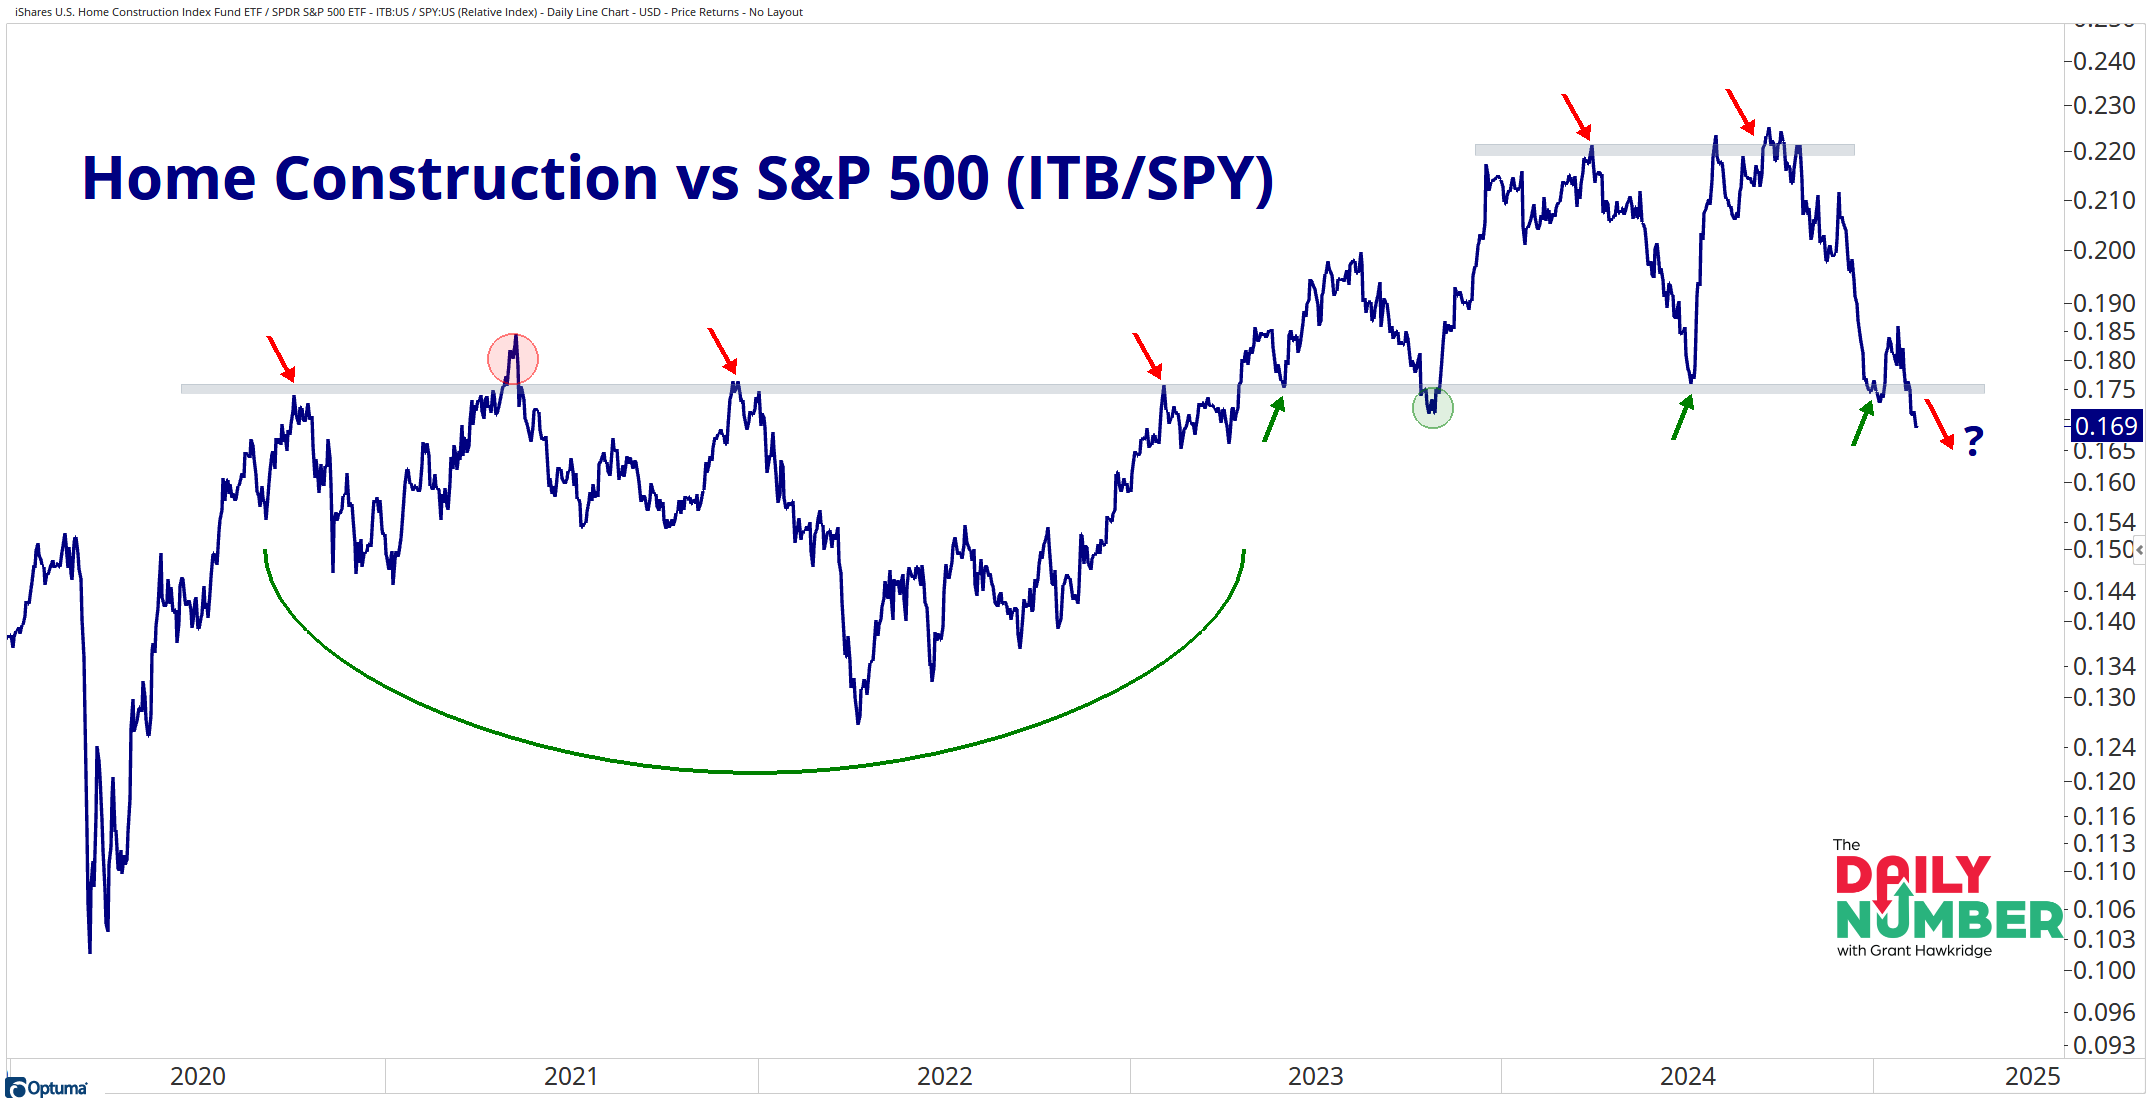
The relative ratio of Home Construction vs S&P 500 has fallen to its lowest level in 22 months.
Here’s the chart:
Let's break down what the chart shows:
The blue line shows the relative ratio of the Home Construction Index $ITB vs S&P 500 $SPY
The Takeaway: One group that has been under selling pressure lately has been Home Construction, and we can highlight this weakness in a relative ratio versus the broader market.
Home Construction is one of the most crucial industry groups in America, as these stocks are highly cyclical. They act as an excellent gauge for growth and often act as a leading indicator for the broader market.
Typically, when home construction stocks are trending higher, it's happening in an environment conducive to risk-seeking behavior. Right now, that is not the case, as this relative ratio is at its lowest level in 22 months.
This does not bode well for risk assets, and if we're really in an environment where risk assets are trending higher and bulls are in control, we want to see the home construction stocks catch a bid here…. Right now, they’re not.
Grant Hawkridge | Chief Aussie Operator, All Star Charts
ICYMI: Steve Strazza did killer session earlier this week breaking down one of the most misunderstood trades in the market right now... China. You can catch the full replay right here
If you find my content valuable, I would greatly appreciate it if you could share it with your friends, family, and colleagues. Your help in spreading the word is invaluable in supporting our work. Thank you to all of you who share!